Population change is primarily driven by two aspects of life: birth and death. The natural movement of the population forms the basis for how a society will evolve, as it is the people themselves who make up the society.
The open data of the Municipality of Patras help us see how the natural population movement has evolved over the past 25 years and what this may imply for the future of the Municipal Units of the Municipality of Patras.
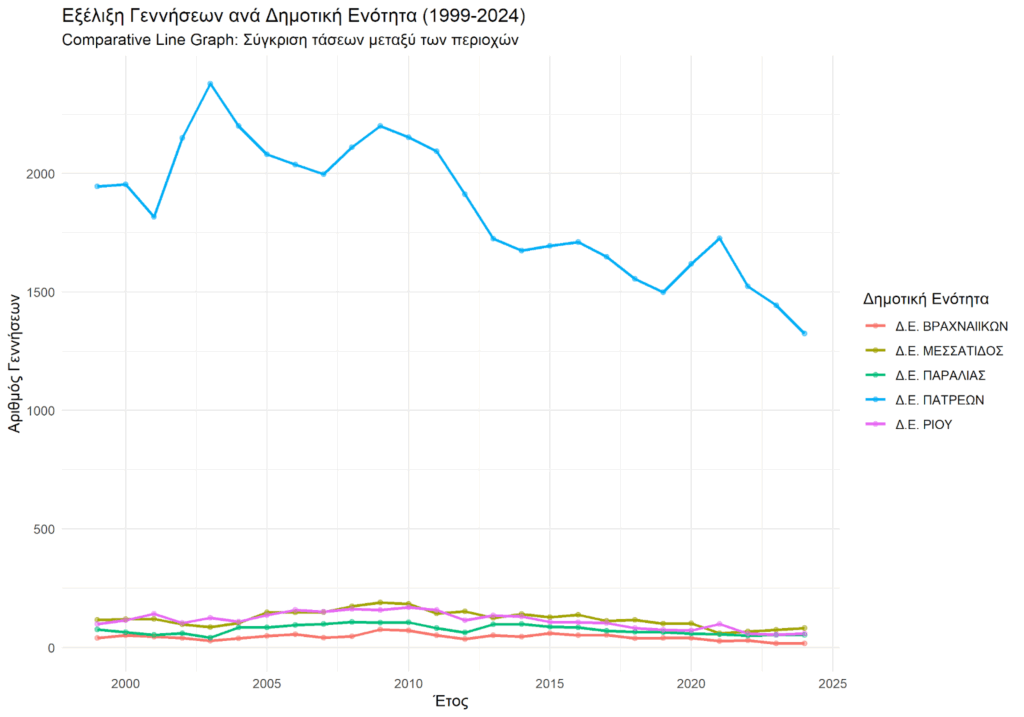
The trend of births in the five Municipal Units of the Municipality of Patras (1999–2024)
- The Municipal Unit of Patras accounts for the majority of births in the Municipality. This occurs because it is the most populous Municipal Unit in the Municipality of Patras.
- Nevertheless, fluctuations in the number of births are observed over the years, which ultimately lead to a decline in the population (2024).
- The other four units remain at much lower levels, and they also follow the same general downward trend.
Chart of Birth Trends by Municipal Unit (1999–2024)
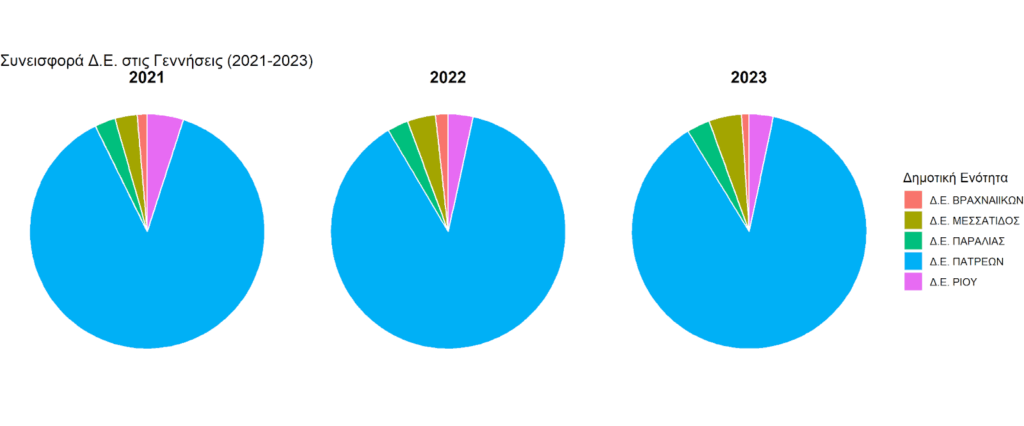
Births in the years 2021–2023
The Municipal Unit of Patras accounts for the overwhelming majority of births, consistently covering about 89% of the total number for each year of the three-year period.
The remaining four units share the remaining 11% of the “pie.” The Municipal Unit of Messatida shows a slight upward trend in its share (from 3.08% in 2021 to 4.57% in 2023), while the Municipal Unit of Rio follows with around 3.3%.
A remarkable stability in the structure of births is observed. Despite the overall decline in numbers, the ratio between the areas has not changed significantly over the past three years, indicating that demographic trends are affecting both the urban and suburban fabric uniformly.
Pie charts of the birth percentages for each Municipal Unit for the years 2021, 2022, and 2023 (Municipal Units 2021, 2022, 2023)
Percentage change in births from the initial year (1999) to the final year (2024)
- The Municipal Unit of Vrachneika shows the sharpest decline, with births decreasing by 57.5%.
- In contrast, the Municipal Unit of Messatida appears to be the most stable area, experiencing the smallest drop (30.17%).
- The central unit (Municipal Unit of Patras) shows a decrease of 31.88%, corresponding to 620 fewer children per year compared to 1999.
Table of Births in 1999 and 2024 and Their Percentage Change (Municipal Units 1999, 2024)
| Municipal Unit | Births 1999 | Births 2024 | Percentage Change |
|---|
| Messatida | 116 | 81 | -30.17% |
| Paralia | 76 | 53 | -30.26% |
| Patras | 1,945 | 1,325 | -31.88% |
| Rio | 99 | 58 | -41.41% |
| Vrachneika | 40 | 17 | -57.50% |
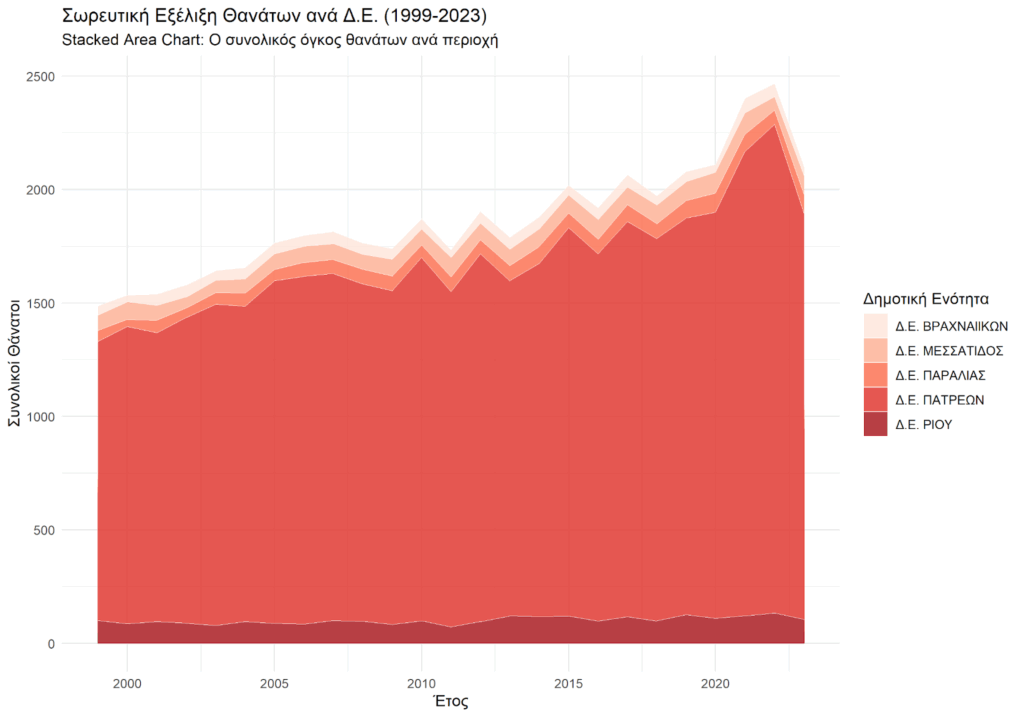
Trend of deaths in the five Municipal Units of the Municipality of Patras
The following chart shows the long-term increase in the total number of deaths in the Municipality, peaking in the most recent three-year period.
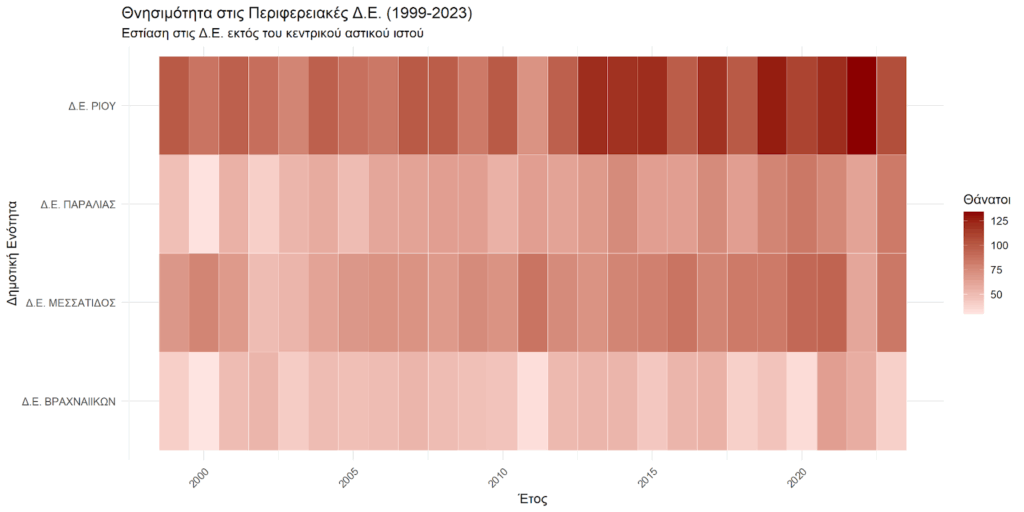
The Municipal Unit of Patras (center) occupies the largest portion of the chart, confirming that the majority of mortality cases are concentrated there. The remaining units follow the same upward trend, while maintaining smaller shares of the total.
Trend of deaths over the years with the contribution of each Municipal Unit (1999–2023, Municipal Units)
Average number of deaths per Municipal Unit (1999–2023)
The central Municipal Unit of Patras (Municipal Unit of Patras) records an average of over 1,500 deaths per year, while in the peripheral units the numbers are significantly lower, with the Municipal Unit of Vrachneika having the smallest average (47.1).
Πίνακας Μέσων όρων θανάτων ανά Δ.Ε. (1999-2203)
| Municipal Unit | Average Annual Deaths (1999–2023) |
|---|---|
| Patras | 1,580.9 |
| Rio | 101.6 |
| Messatida | 73.8 |
| Paralia | 62.4 |
| Vrachneika | 47.1 |
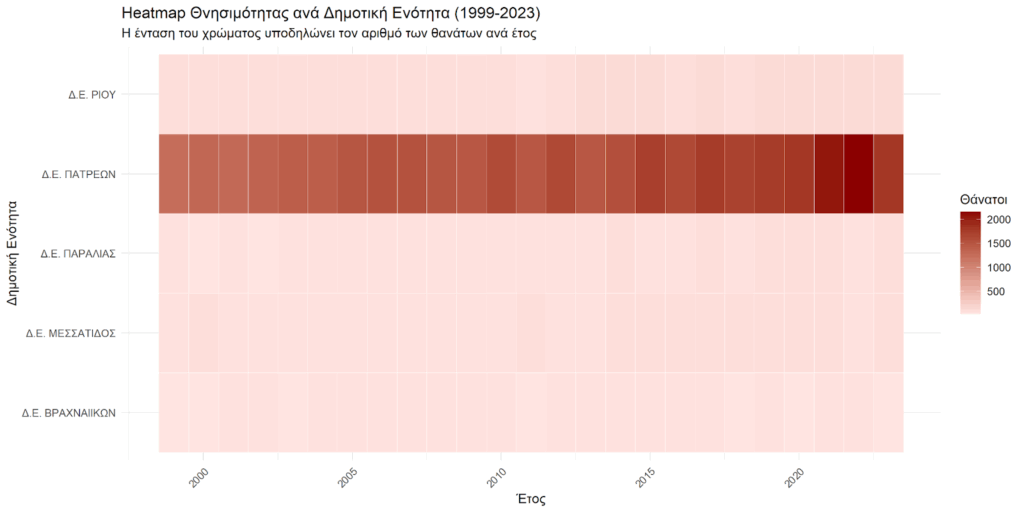
The Municipal Unit of Patras consistently appears in the darkest color, indicating the highest burden.
It is evident that toward the end of the period (right side of the chart), the color intensifies across all areas, confirming that the increase in deaths is a phenomenon affecting the entire Municipality uniformly.
Mortality Heatmap by Municipal Unit (1999–2023)
Deaths excluding the central unit (Municipal Unit of Patras)
The following chart (heatmap) focuses on the remaining Municipal Units, excluding the Municipal Unit of Patras, in order to highlight more clearly the individual trends in the Municipality’s periphery.
With the dominant urban center removed, it becomes evident that the Municipal Units of Rio and Messatida show the highest numerical burden of deaths, especially during the last decade.
The overall trend of the heatmap toward the right side remains visible, emphasizing that demographic aging and the gradual increase in mortality are phenomena evolving simultaneously across all suburban and rural areas.
Mortality Heatmap of the Municipal Units of Patras excluding the Municipal Unit of Patras (for better visualization of the remaining units)
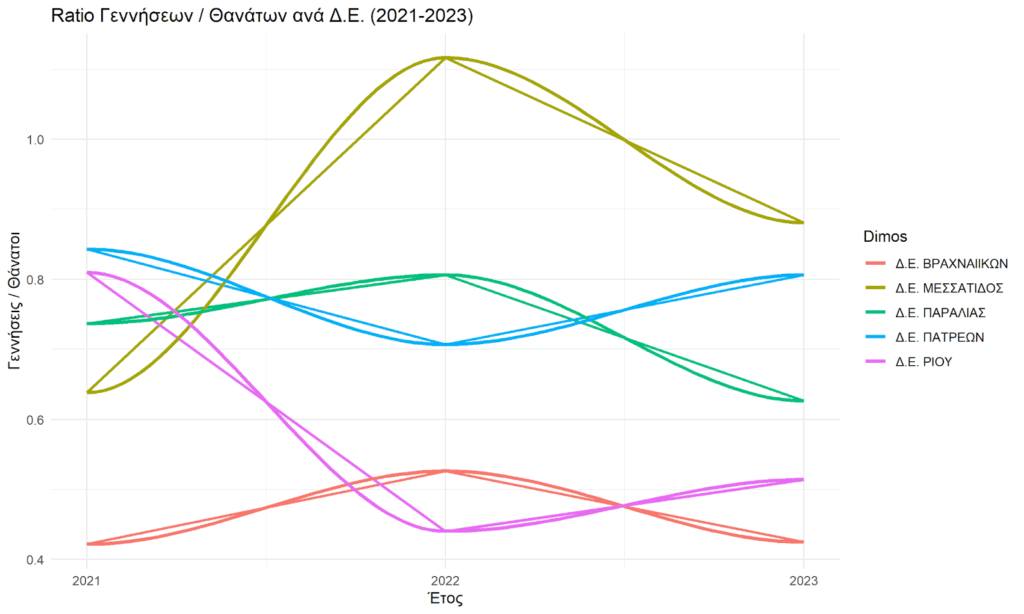
Natural Population Balance – What It Is and What It Reveals About the Future of the Five Municipal Units of the Municipality of Patras
The natural population balance is a demographic measure that highlights the relationship between births and deaths over a given period.
Specifically, it is the ratio of total births to total deaths for each year, expressed as:
N.P.B. = Total Births / Total Deaths
Observations:
- The births-to-deaths ratio shows a remarkable rise in 2022 for the Municipal Unit of Messatida, surpassing 1 (more births than deaths), before sharply correcting to 0.88 in 2023. It nevertheless remains the “youngest” area.
- After a decline in 2022, the central unit (Municipal Unit of Patras) shows signs of recovery in 2023, closing at 0.81.
- The Municipal Unit of Rio experienced a dramatic drop in 2022, but in 2023 it presents a hopeful recovery at 0.51.
- The Municipal Unit of Vrachneika remains stable at low levels (0.42), indicating an aging population with very few new births.
- The Municipal Unit of Paralia shows a decline in the ratio during the 2022–2023 period, reaching 0.62.
Natural Population Balance: Births / Deaths by Municipal Unit (2021–2023)
Natural Population Balance Heatmap (Births/Deaths) by Municipal Unit (2023)
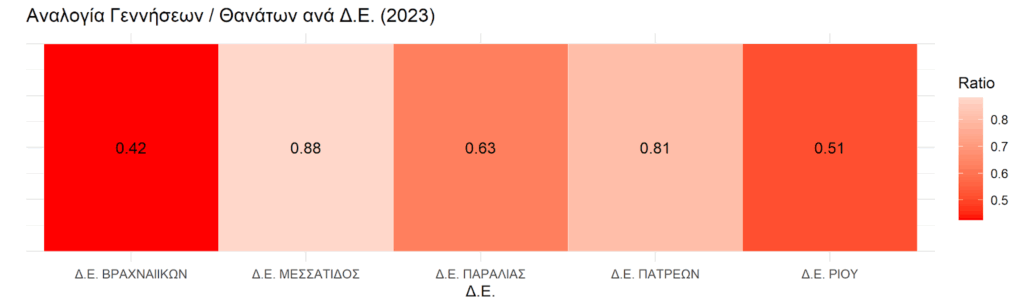
For 2023, the following observations emerge:
- The Municipal Units of Rio (0.51) and Vrachneika (0.42) show the most pronounced demographic imbalance. Here the situation is critical, with approximately 2.5 deaths occurring for every birth.
- The Municipal Unit of Paralia (0.63) follows, with roughly 1.6 deaths per birth, remaining on a steady path of natural population decline.
- The Municipal Units of Messatida (0.88) and Patras (0.81) are closest to demographic replacement, helping to maintain the Municipality’s overall average.
The overall picture from the analysis of the Municipality of Patras’ open data is:
This situation serves as a “warning bell” for the future of the Municipality and its Municipal Units, as demographic changes directly affect the area’s economic and social sustainability.
In recent years, the natural population balance has been below 1 (<1), meaning that births are fewer than deaths. This highlights population aging across all Municipal Units, and therefore across the Municipality of Patras as a whole.
Potential Implications of a Natural Population Balance (N.P.B.) < 1 for the Future of the Municipality of Patras
- Labor Shortage: Fewer young people entering the local workforce, creating difficulties for businesses to find staff.
- Reduced Local Revenue: Fewer workers translate into lower tax income and municipal fees for the Municipality.
- “Gray” Consumption: Market demand shifts from education, entertainment, and family-oriented services toward healthcare and eldercare services. Risk of Depopulation: Long-term threat to property values and the vibrancy of local communities.
Data
Attracting young residents—such as digital nomads—and leveraging the graduates of the University of Patras becomes essential.
The data presented are based on open data from the Municipality of Patras and aim to inform and enhance understanding of the city’s demographic trends.
You can access the datasets analyzed at the following link: https://catalog.data.patras.gr/dataset/fysikh-kinhsh-plhthysmou
For detailed datasets, additional charts, and options to download and reuse the data, you can visit the official Open Data website of the Municipality of Patras here: https://catalog.data.patras.gr/dataset/