A city’s population does not change abruptly. It changes slowly, through small daily choices: when we start a family, where we choose to live, and how health and quality of life evolve. The open data of the Municipality of Patras helps us see how the natural population movement has evolved over the last 25 years and what this might mean for the city’s future.
The trajectory of births in the Municipality of Patras
From 1999 to 2024, births in Patras show a general downward trend, with some years exhibiting slight increases or stabilization. The early 2000s present a relatively better outlook, peaking in 2009, the year during which the highest number of births was recorded (2,729). From that point onward, the trend gradually shifts, with the decline becoming more pronounced after 2021. In 2024, the lowest number of births for this period was recorded (1,534).
Line chart of birth trends in the Municipality of Patras over time (1999-2024)
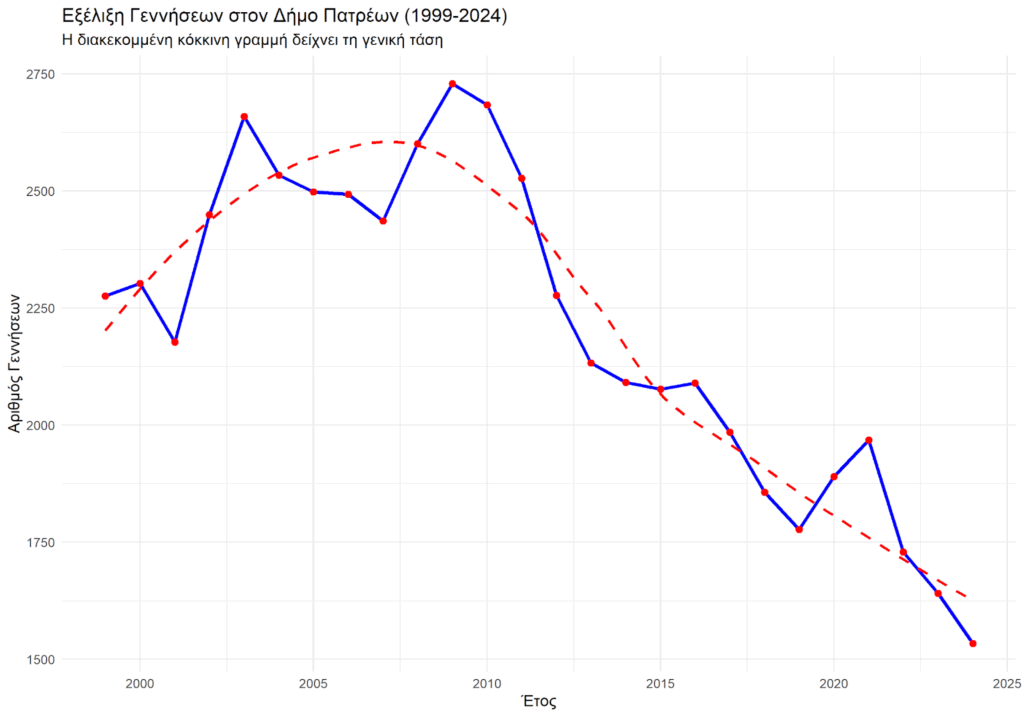
The total difference between the highest and lowest points of the period reaches 1,195 fewer births per year, a shift that reflects changes in lifestyle, social conditions, and household choices.
How births change per five-year period When examining the data over longer intervals (five-year periods), the picture becomes clearer.
The 2014–2018 period recorded the largest drop in the number of births. In more recent years, the total number appears slightly increased; however, this is due to the fact that the 2019–2024 period includes more years. If we consider the average annual number of births, it is evident that levels remain lower compared to the first decade of the analysis.
Table: Percentage change in births per five-year period (change concerns the total births of each five-year period compared to the previous one)
| Period | Births | Percentage Change (%) |
| 1999-2003 | 11,864 | – |
| 2004-2008 | 12,562 | +5.88% |
| 2009-2013 | 12,350 | -1.69% |
| 2014-2018 | 10,100 | -18.22% |
| 2019-2024 | 10,539 | +4.35% |
Death trends in Patras
During the same period, the number of deaths followed an opposite trajectory.
Line chart of death trends in the Municipality of Patras over time (1999-2023)
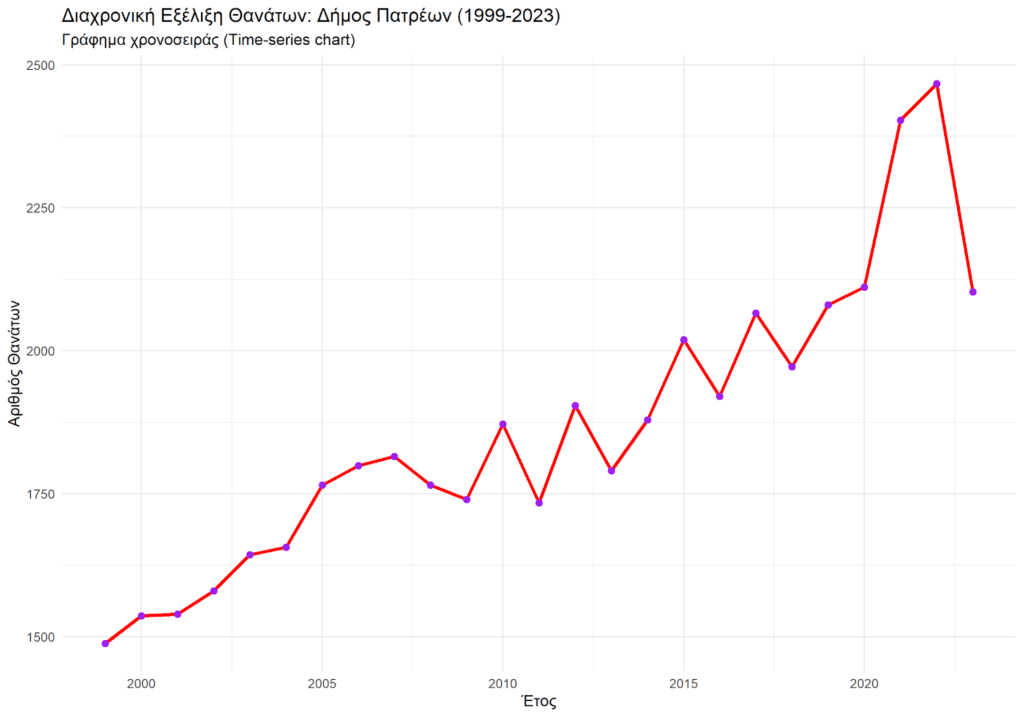
From 1999 to 2023, a steady upward trend was recorded, with sharp fluctuations from year to year. The most intense increase appeared during the 2020–2022 period, while in 2023 a slight deceleration was observed, without returning to the levels of previous decades.
The highest number of deaths was recorded in 2022 (2,467), while the lowest was in 1999 (1,488). Overall, within 25 years, deaths increased by approximately 41%.
Table: Total percentage change (increase) in the number of deaths in the Municipality of Patras (1999-2023)
| Year | Number of Deaths | Percentage Change (%) |
| 1999 | 1,488 | – |
| 2023 | 2,103 | +41.33% |
What “Natural Balance” means in practice
To understand the overall picture, we examine the natural balance, which is the relationship between births and deaths.
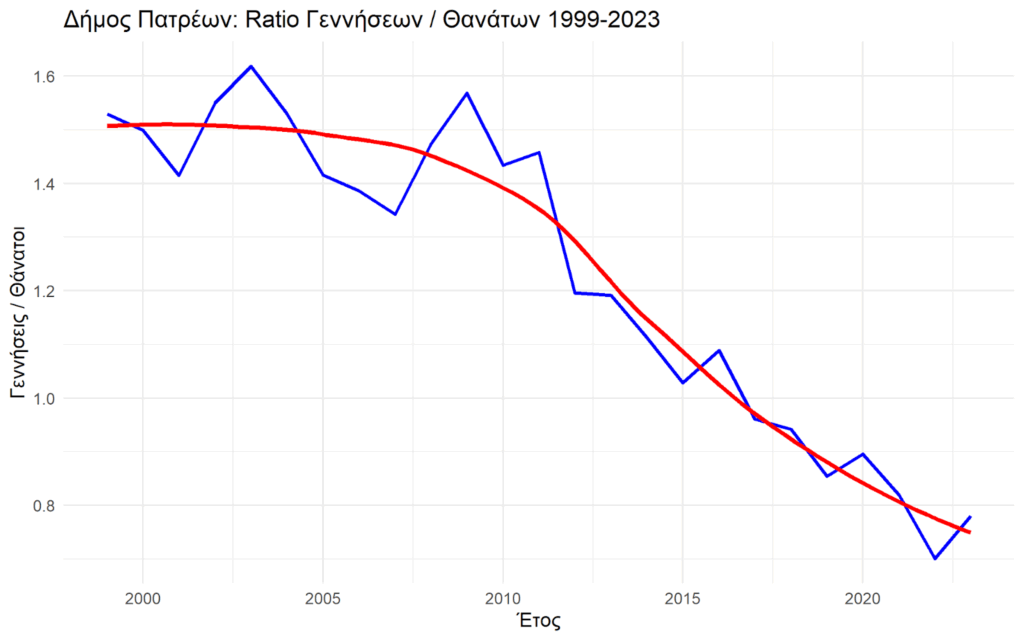
When births outnumber deaths, the population increases naturally. Conversely, when deaths exceed births, the population decreases
In Patras:
- Until 2017, the balance remained positive.
- From 2017 onwards, the ratio gradually dropped below one.
- In 2023, for every 100 deaths, there were approximately 75 births.
What the data shows overall
Open data allows us to see the city not as a static entity, but as a living, evolving organism. Understanding this data is the first step toward creating a city that is friendlier, more functional, and more human-centric.
The information presented is based on open data from the Municipality of Patras and aims to inform and provide an understanding of the city’s demographic trends.
You can find the analyzed datasets at the following address: https://catalog.data.patras.gr/dataset/fysikh-kinhsh-plhthysmou
For detailed datasets, additional charts, and the ability to download and reuse the data, you can visit the official Open Data portal of the Municipality of Patras at: https://catalog.data.patras.gr/dataset/